Enterprise Rent-A-Car Website
Overview
GOAL
Start by redesigning and launching the website to reach parity with competitors. This meant a modern looking website with a clear way to book and track rentals. Post launch focused on utilizing analytics to improve the web experience push and past parity with competitors .
ROLE
PRE-LAUNCH: Researcher, Usability Testing (Team of 4 UXers)
POST LAUNCH: Lead UX Designer, Researcher (Team of 3 UXers)
KEY PROBLEMS TO SOLVE
This project was being designed along side the app (which I lead the designs for) so making sure the two worked together to present a cohesive experience was important.
Identify which services users valued most
Users struggled with finding open locations during off hours and days.
Research Phase
The research phase included competitor assessments, current state evaluations, user interviews and testing.
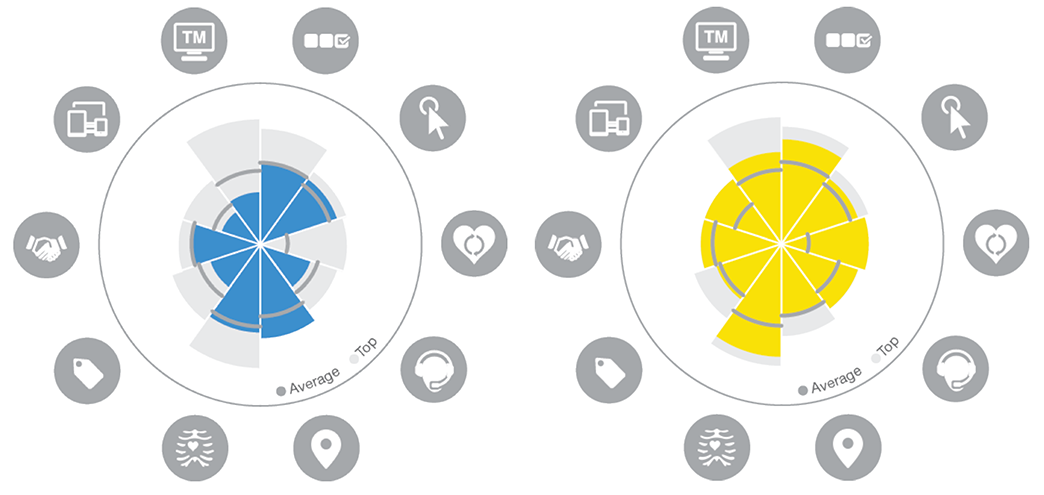
Evaluating Enterprise’s current offering and comparing it to competitors in the market highlighted areas to improve. A key goal of the project was to reach parity with competitors and this provided data to drive features to prioritize.
However, just because a competitor is doing doesn’t mean it is the best solution. So these decisions were all validated later user testing.
Graphs show an overview of Enterprise and competitors in each category. This facilitated conversations with stakeholders on which features to prioritize.


User interviews and testing were done to make sure business goals did not ignore user goals.
Journeys were created to highlight key opportunities in the user’s interaction points with Enterprise.
Pain Point Exploration
After the site was launched, (when I joined to lead designs) analytics and testing identified users were having difficulty selecting locations if their initial selection didn’t match their date and times. User’s would not get the error until they selected a location meaning they would have to keep blindly selecting locations in order to figure out if it matched their travels.
Designs were made to solve the closed location problem. Looking at user behaviors via analytics we identified two key behaviors.
1) Time flexible users
They did not want to explore alternate nearby rental location instead opting to adjust their travel date/time.
2) Location Flexible users
These users absolutely had to have their initial dates and time but were willing to go a little further to another pick up location.
Designs created paths for both of these user types. It clearly highlighted open/closed locations for those that were location flexible. It also clearly gave the option to ‘adjust times’ (instead of select) for those that were time flexible. The progress bar at the top was also a side goal of this update to try and minimize its pixel height.
The Design
KEY SOLUTIONS
Clearly marks closed locations so users who are location flexible can pick the nearest location that fits their needs.
Make time and date adjustments very quick for users who were not location flexible.
LOCATION FLEXIBLE USER
Closed locations are marked on both the map icons and the list. This solved the problem of users bouncing around locations trying to find one that worked for them.
This helps location flexible user. On hover a user could get more information on hours to figure out if it was their pick-up or return date/time that was causing the problem.
TIME FLEXIBLE USER
If a user couldn’t select another location, the UI highlighted what they needed to fix in order to rent at that location.
This helps time flexible users. Adjusting your pickup by an hour could be easier than a whole day. It was made clear when that was an option.
The UI also needed to display in other languages that could change copy length. (ex. German tends to group words together which could result in odd wrapping)
MOBILE
Mobile breakpoints took the same approach but reduced the amount of information displayed at once to make consuming the information easier.
A peak at the rest of the site


Research drives good design,
so here is a random fact
Which US region has the longest commute? On average drivers in the mid-west spend 44.5 min/day driving, the south 49.9 min/day, the north-east 51.1 min/day and the most is the west at 58.9 min/day.


